
The University of Southern Maine and Maine Maritime Academy were recently identified as Maine’s most expensive public colleges as measured by average net price in 2011-12 based on a recent update to the U.S. Department of Education’s College Affordability and Transparency Center.
The College Affordability and Transparency Center’s interactive search tool highlights institutions with the highest and lowest tuition and net price, and those schools where prices are rising the fastest. Net price is the amount students paid for tuition and required fees, room and board, books and supplies, and other expenses after receiving grant and scholarship aid. At public institutions, only in-state students are included in this calculation. Based on net price, five of New England’s 43 public four-year institutions are in the nation’s top 30 most expensive institutions.
Average net price has often been cited as a panacea for students and families looking to compare the affordability of different institutions. However, there is more to these rankings than meets the eye. The U.S. Department of Education calculates average net price at public institutions only for select students: in-state, first-time, full-time degree-seeking undergraduates who received federal, state, local or institutional grant aid.
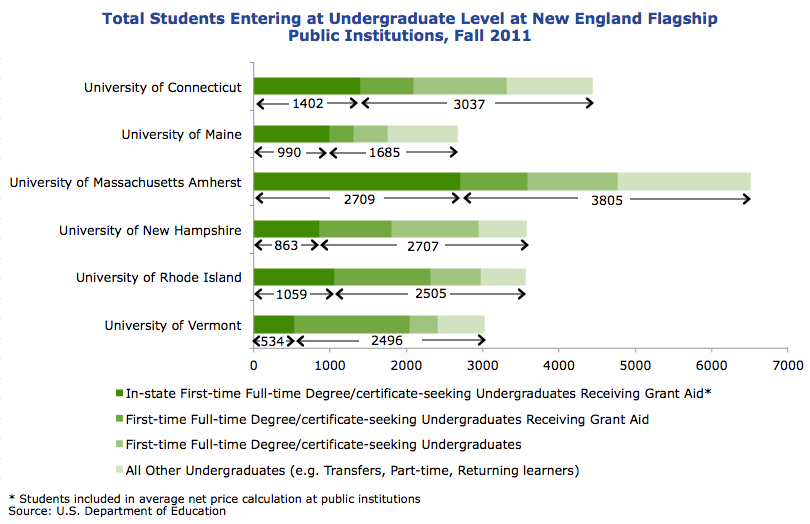
But rarely does an institution serve a student body made up entirely of first-time, full-time students—never mind in-state students. At New England’s flagship institutions (typically the largest, most selective, oldest land-grant institution in a state), for instance, as much as 85% of first-time full-time students receive some kind of grant or scholarship aid. Taking in-state status into account decreases the number of students represented by average net price even more.
 Click on the chart to enlarge.
Take, for example, the University of Vermont. While 68% of incoming undergraduate students received at least some form of grant or scholarship aid, only 26% of these were in-state students, meaning University of Vermont’s average net price is applicable only to 18% of its incoming undergraduate class in fall 2011.
At the University of Maine, in-state students make up 76% of all the first-time, full-time undergraduates receiving grant aid, but only 65% of the total incoming class that year were first-time full-time undergraduates. This leaves University of Maine’s average net price applicable to 37% of its incoming undergraduate class in fall 2011.
Among the region’s flagship institutions, the average net price listed by the Education Department’s Affordability and Transparency Center is based, at best, on only 42% of an incoming class (found at the University of Massachusetts Amherst).
This multitude of important caveats and distinctions makes average net price a very specific, targeted measure. It can be enormously helpful—by communicating, for example, the important role financial aid plays in college affordability. As a measure to compare institutions, however, it may be less apropos.
Take, for example, any of the following scenarios that could decrease the number of students included in the average price calculation:
- A state reduces the reach of its grant aid program, either by awarding larger amounts to fewer students or scaling back overall,
- An institution begins shifting its focus to serving post-traditional student populations—returning learners, transfer students and part-time students, or
- A declining population of high school graduates within the state drives institutions to enroll more out-of-state students.
Is there a way to paint a picture of college affordability that addresses the diverse students New England institutions serve? Maybe. One way might be to consider average net price alongside various other measures, such as:
- Average amounts and number of recipients of federal, state and institutional grant aid,
- Average amounts and number of recipients of federal student loans, or
- Total cost of attendance for different categories of students compared with the state or region’s median household income.
There is no one-size-fits-all metric to gauging how the price of college impacts students and families, institutions, and states and their economies. Still, the conversation on college affordability is critical, and average net price is a good place to start. So let’s keep talking.
For more on college finance and affordability in New England, see NEBHE’s recently revamped Trends & Indicators, which provides charts and tables tracking high-level finance and affordability trends.
For more on financial aid, check out NEBHE’s ongoing Redesigning Aid in New England project, which engages the states of Maine, Massachusetts, and Rhode Island in work that aims to assess and redesign state financial aid policies and programs.
Gretchen Syverud is policy research analyst at NEBHE.
[ssba]