Blog Content
June 21, 2010
Fig. 12: Indicators of College Readiness: A State-by-State Comparison
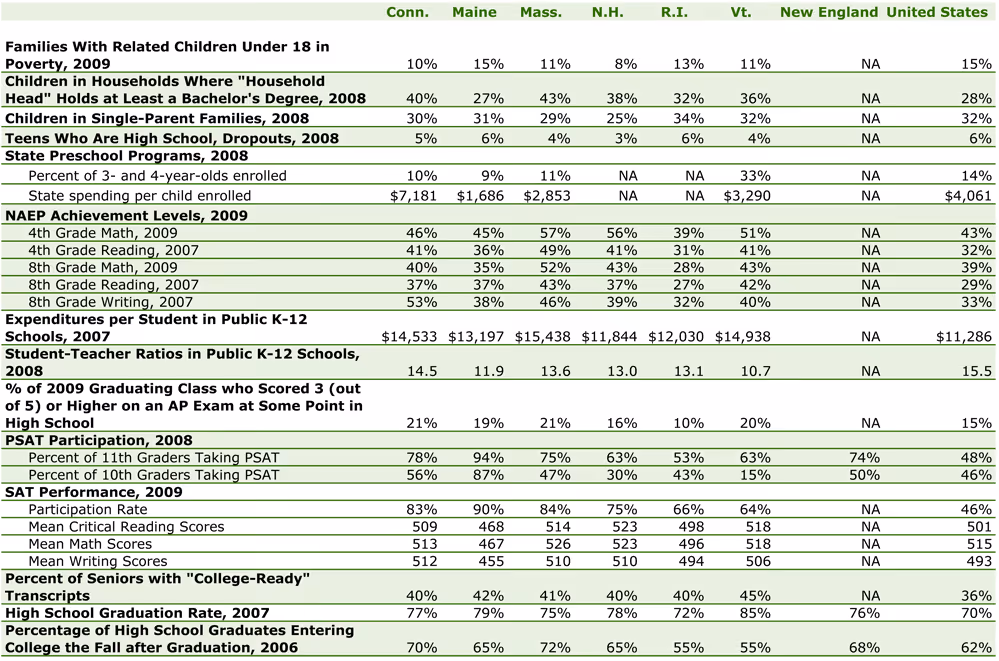
Notes: For Maine, preschool data refer to 4-year-olds only; New Hampshire and Rhode Island have no distinct state preschool programs. NAEP Achievement Levels represent the percentage of students that scored proficient on the National Assessment of Educational Progress (NAEP) exams. In order to have a “College-Ready Transcript” students must have taken at least four years of English, three years of math, and two years of natural science, social science and foreign language before graduating from high school.
Sources: U.S. Census Bureau, National Institute for Early Education Research, Editorial Projects in Education Research Center, The College Board, National Center for Higher Education Management Systems, Kids Count, Annie E. Casey Foundation, National Assessment of Educational Progress (NAEP), Manhattan Institute.
Fig. 13: Projection of High School Graduates and Non-graduates in New England and the United States
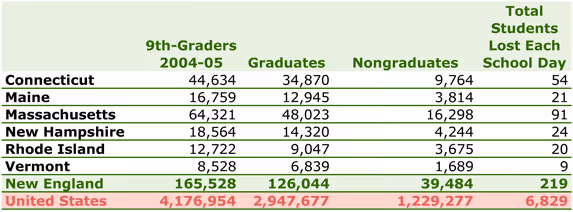
Source: New England Board of Higher Education analysis of Editorial Project in Education (EPE) Research Center data, Diplomas Count 2008.
Fig. 14: Percent of High School Graduates Enrolled in College the Fall after Graduating High School, 2008
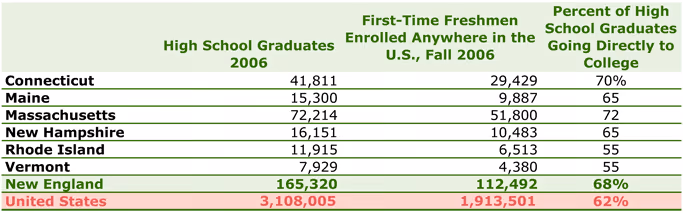
Source: New England Board of Higher Education analysis of National Center for Higher Education Management Systems data.
Fig. 15: Migration of First-Time Freshmen to and from New England, 2008
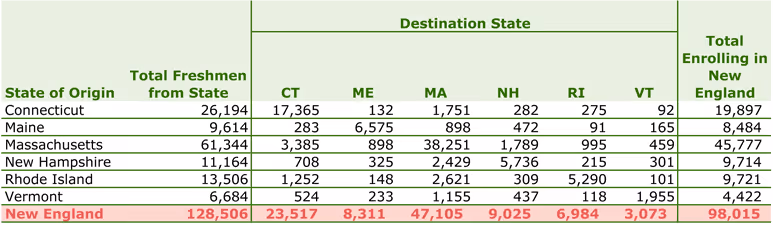
Note: 2007 was a voluntary reporting year for institutions reporting on migration; 2008 is a mandatory reporting year which may result in greater totals.
Source: New England Board of Higher Education analysis of U.S. Department of Education data.
Fig. 16: Intended College Majors of College-Bound Seniors in New England, 2009
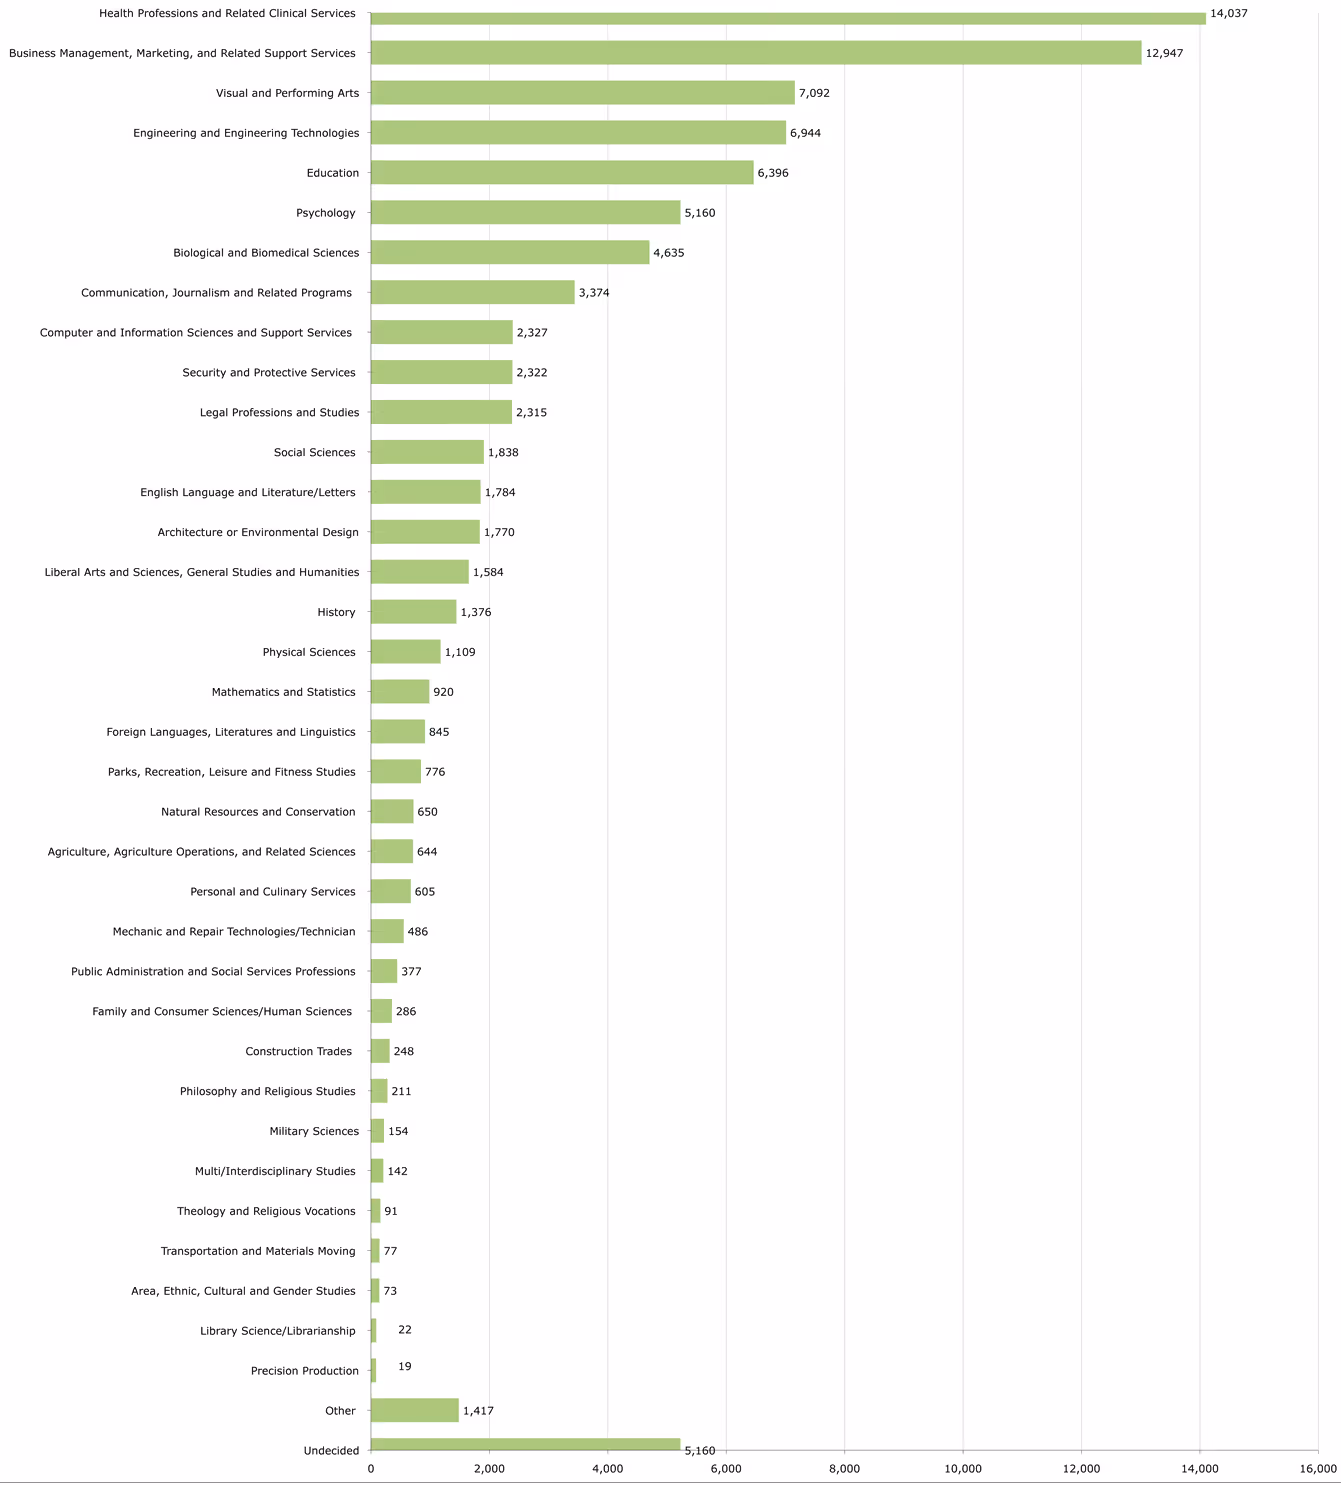
Source: The College Board.