Blog Content
June 21, 2010
Fig. 1: Change in Population, 1990 to 2009, New England States and Other Regions
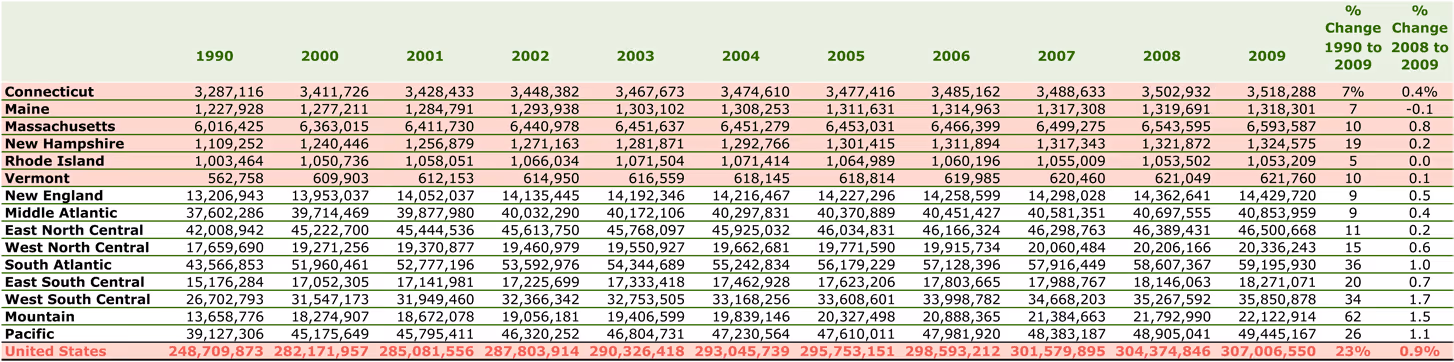
Note: Middle Atlantic includes New Jersey, New York, Pennsylvania. East North Central includes Ohio, Illinois, Indiana, Michigan, Wisconsin. West North Central includes Minnesota, Iowa, Missouri, North Dakota, South Dakota, Nebraska, Kansas. South Atlantic includes Delaware, Maryland, District of Columbia, Virginia, West Virginia, North Carolina, South Carolina, Georgia, Florida. East South Central includes Kentucky, Tennessee, Alabama, Mississippi. West South Central includes Arkansas, Louisiana, Oklahoma, Texas. Mountain includes Montana, Idaho, Wyoming, Colorado, New Mexico, Arizona, Utah, Nevada. Pacific includes Washington, Oregon, California, Alaska, Hawaii.
Source: New England Board of Higher Education analysis of U.S. Census Bureau data
Fig. 2: Population of New England by Race, 2008
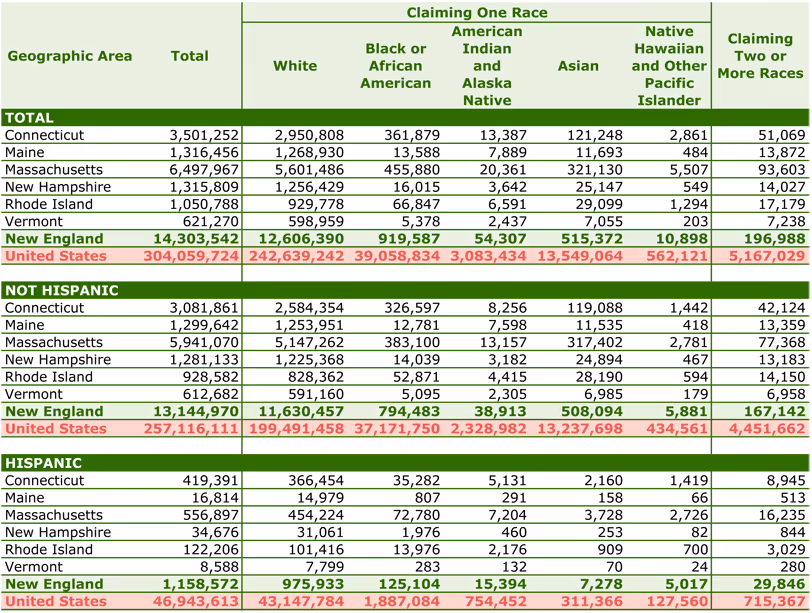
Note: The above categories reflect the U.S. Census Bureau Guidance on the Presentation and Comparison of Race and Hispanic Origin.
Source: New England Board of Higher Education analysis of U.S. Census Bureau data.
Fig. 3: Components of Resident Population Change, 2000 to 2009
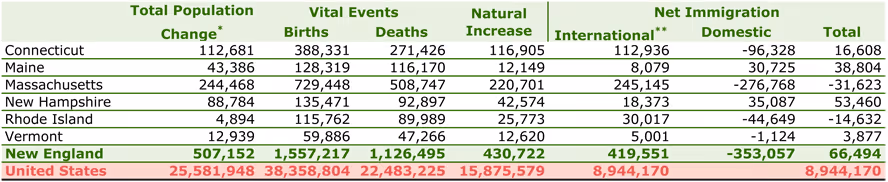
Note: Total population change includes a residual. This residual represents the change in population that cannot be attributed to any specific demographic component. See State and County Terms and Definitions at http://www.census.gov/popest/topics/terms/states.html. Net international migration includes the international migration of both native and foreign-born populations. Specifically, it includes: (a) the net international migration of the foreign born, (b) the net migration between the United States and Puerto Rico, (c) the net migration of natives to and from the United States, and (d) the net movement of the Armed Forces population between the United States and overseas.
The April 1, 2000 Population Estimates base reflects changes to the Census 2000 population from the Count Question Resolution program and geographic program revisions. Dash (-) represents zero or rounds to zero. See Geographic Terms and Definitions for a list of the states that are included in each region.
Source: New England Board of Higher Education analysis of U.S. Census Bureau data
Fig. 4: Racial Composition of Northern and Southern New England, 2009
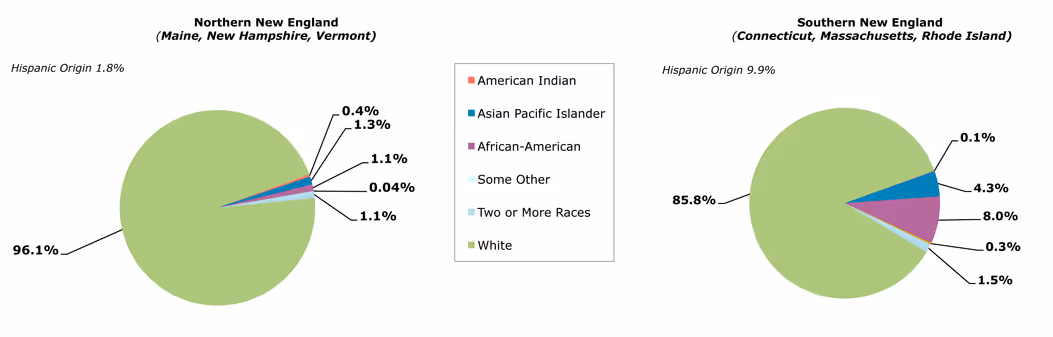
Fig. 5: Growth in the Number of Persons Obtaining Legal Permanent Resident Status in New England, 1998 to 2008
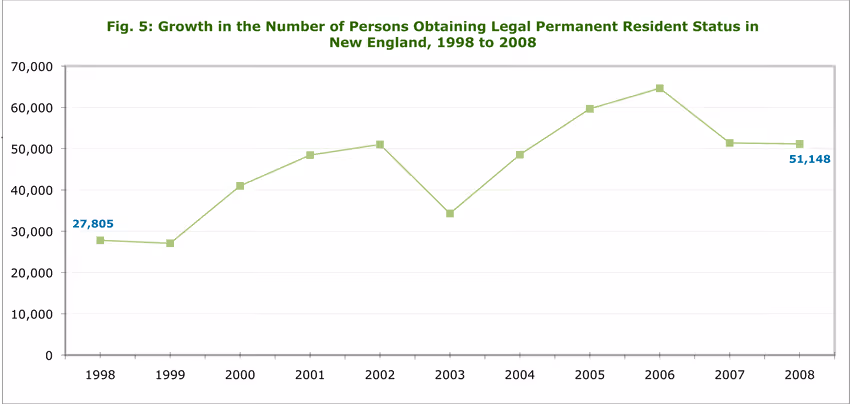
Source: New England Board of Higher Education analysis of U.S. Department of Homeland Security data.