Blog Content
June 21, 2010
Fig. 49: Average Student Expenses, New England vs. United States, Academic Year 2009 – 2010
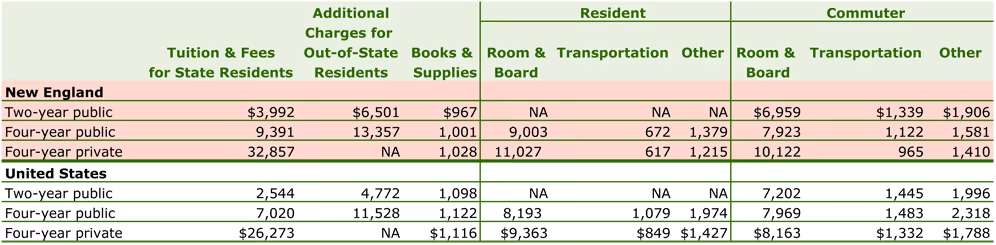
Note: Room & board costs for commuter students are average estimated living expenses for students living off-campus but not with parents.
Source: Table 6, Average Student Expenses, by College Board Region, 2009-2010 (Enrollment-Weighted). Trends in College Pricing 2009, (2009); 11. Copyright © 2009 College Entrance Examination Board. Reprinted with permission. All rights reserved.
Fig 50: Tuition and Fees, Academic Years 2008-09 to 2009-10 and Percent Change
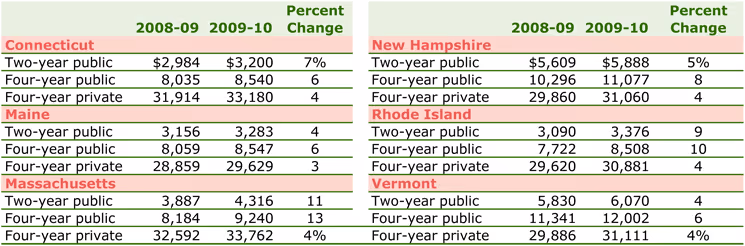
Note: Figures for public institutions show rates for state residents. All data are enrollment-weighted averages, intended to reflect the average costs that students face in various types of institutions.
Source: Table 6c, Tuition and Fees by Region and Institution Type, in Current Dollars, 2008-2010 (Enrollment-Weighted). Trends in College Pricing 2009, (2009); 14. Copyright © 2009 College Entrance Examination Board. Reprinted with permission.
Fig. 51: State Fiscal Support for Higher Education, by State, and National Aggregate Local Tax Support for Higher Education, Fiscals Years 2008-09, and 2009-10
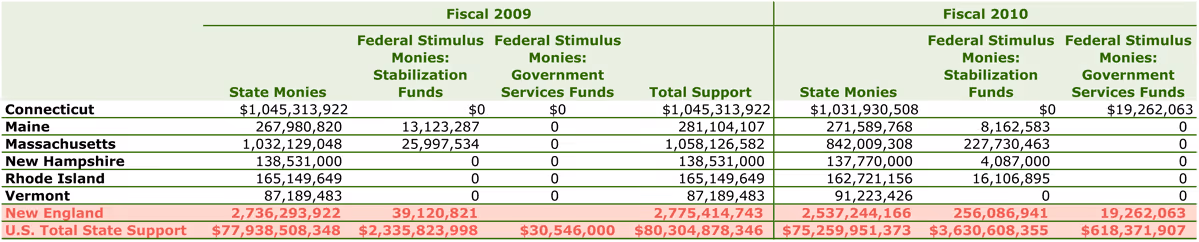
Note: Fiscal 2010 figures on state support for higher education represent initial allocations and estimates reported by the states from September through December 2009 and are subject to change. State monies include state tax appropriations and other state funds allocated to higher education. Federal stimulus stabilization funds include funds used to restore the level of state support for public higher education. Federal stimulus government services funds exclude funds used for modernization, renovation or repair.
Source: New England Board of Higher Education analysis of data from Illinois State University Center for Higher Education and Education Finance.
Fig. 52: Undergraduate and Graduate Student Aid by Source, 2008-09
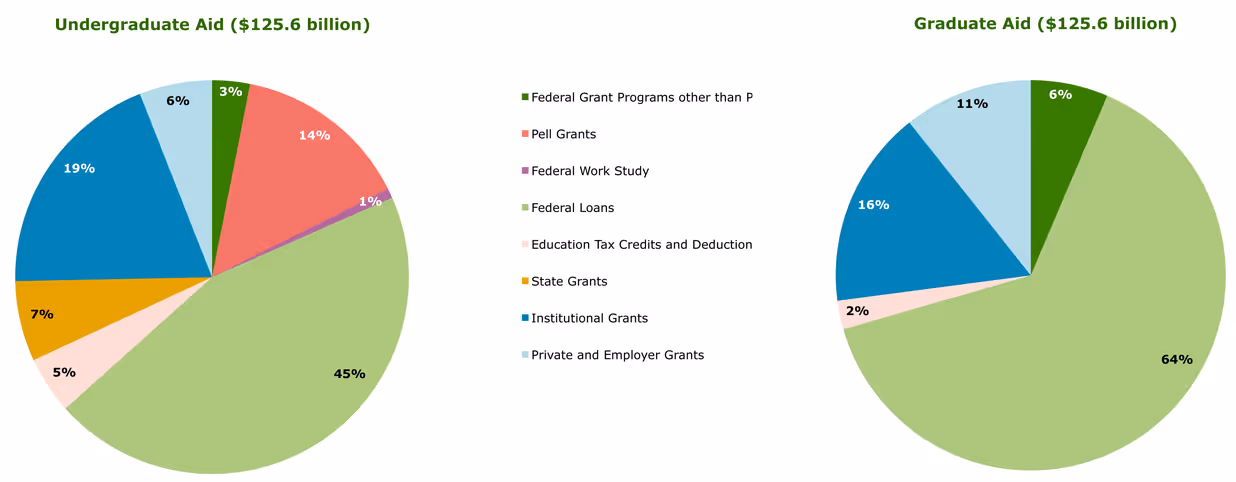
Source: Trends in Student Aid. Copyright ©2008 The College Board. All rights reserved.
Fig. 53: Federal Student Financial Aid Programs-Total Expenditures or Allocations and Number of Recipients
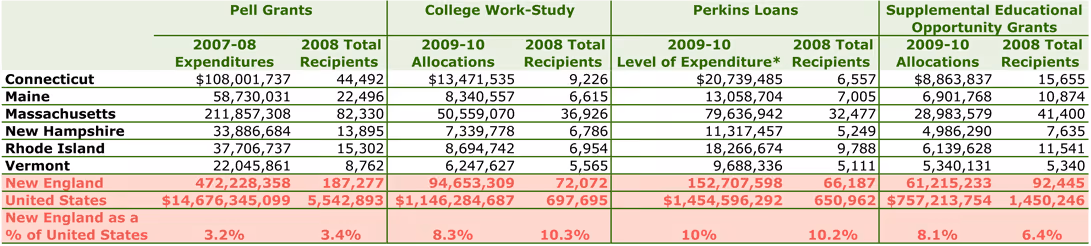
Note: Spending on federal campus-based programs is reported as 2009-10 allocations. Spending on Pell Grants is reported as 2007-08 expenditures.
*Level of Expenditure (LOE): A school must request and have approved for each award year an LOE authorization that represents the maximum amount it may expend from its revolving Federal Perkins Loan fund.
Source: New England Board of Higher Education analysis of U.S. Department of Education data.
Fig. 54: Total State Grant Aid Awarded, by State, 1997-98, 2002-2003, 2006-07, 2007-08
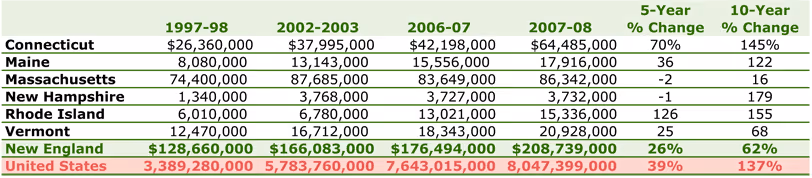
Note: Figures may not include aid funds provided through entities other than the principal state student aid agency.
Source: National Association of State Student Grant and Aid Programs.
Fig. 55: State Need-Based Aid as a Percent of Federal Pell Grant Aid, 2008
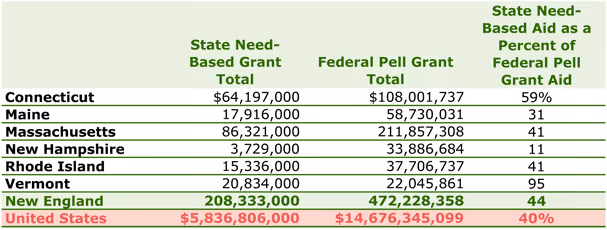
Source: New England Board of Higher Education anlaysis of data from National Association of State Student Grant and Aid Programs and U.S. Department of Education data.
Fig. 56: Percent of Family Income Needed to Pay for College by Income Groups, 2008
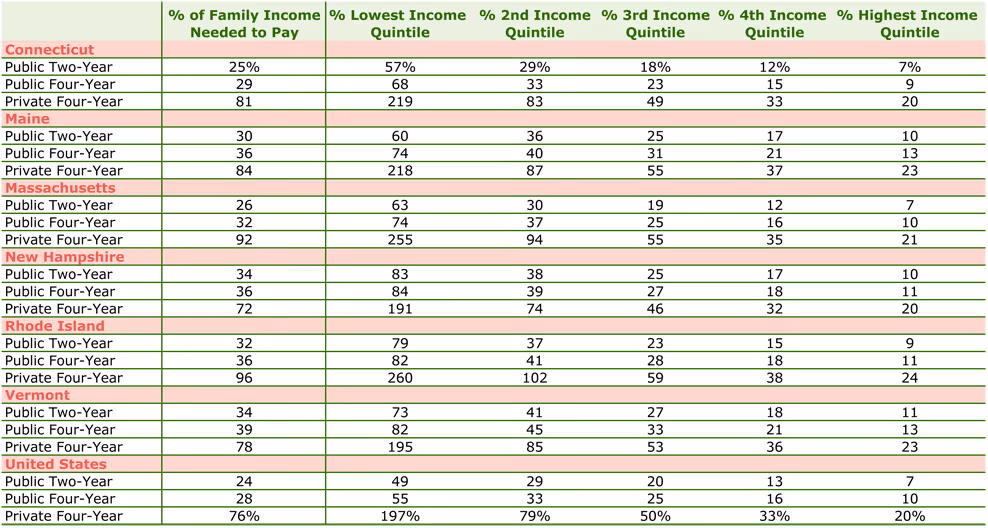
Source: The National Center for Higher Education Management Systems (NCHEMS).
Fig. 57: Distribution of Federal Aid Funds by Type of Institutions, 2007-08
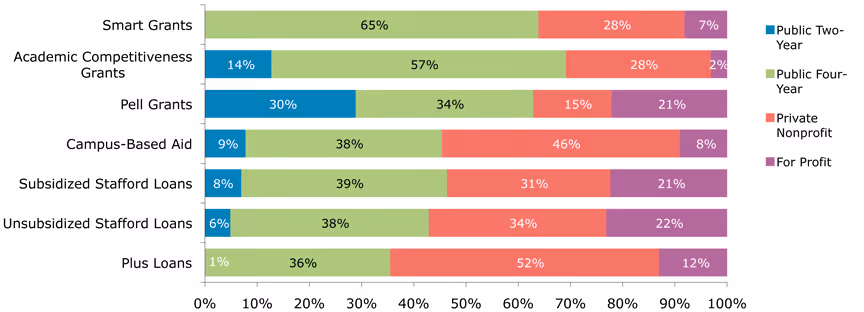
Note: The figures reported here reflect total student aid amounts divided across all students, including non-recipients. Total aid includes Federal Work-Study and Education Tax Benefits. Loan numbers do not include private non-federal loans, which provide funding for students but do not involve subsidies.
Source: New England Board of Higher analysis of College Board data.
Fig. 58: Average Student Debt and Percent of Students with Debt by State, Class of 2008
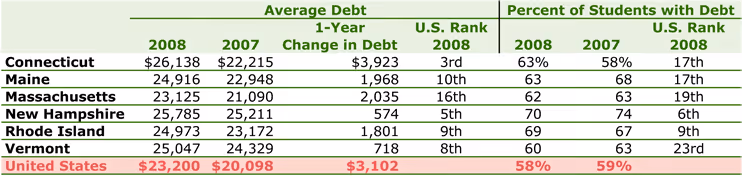
Source: New England Board of Higher Education analysis of data from the Project on Student Debt.
Fig. 59: New England Ten Largest College Endowments, Fiscal 2009
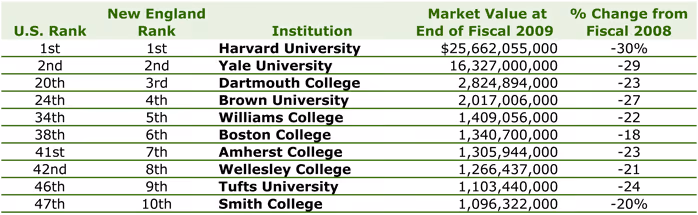
Note: MIT did not participate in the 2009 endowment survey. In 2008, MIT’s endowment ranked 3rd in New England and 6th in the U.S.
Source: New England Board of Higher Education analysis of 2009 National Association of College and University Business Officers data.