Blog Content
June 21, 2010
Fig. 20: Public vs. Private College Enrollment in New England, 1998 to 2008
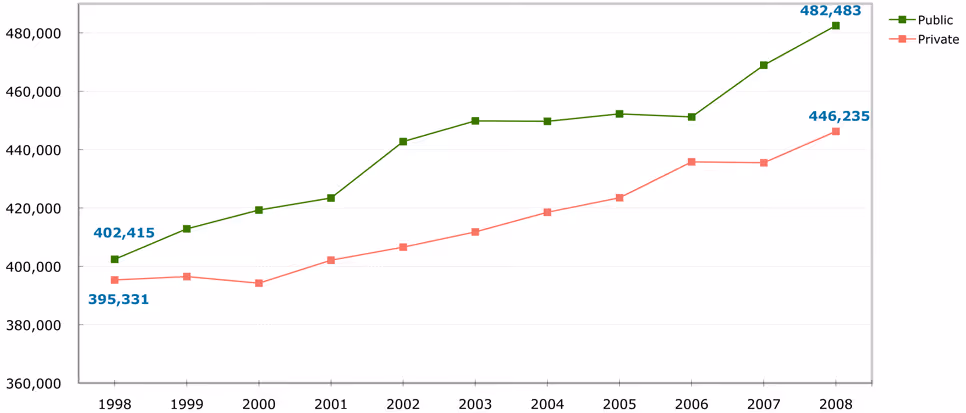
Source: New England Board of Higher Education analysis of U.S. Department of Education data.
Fig. 21: Undergraduate vs. Graduate Enrollment in New England, 1998 to 2008
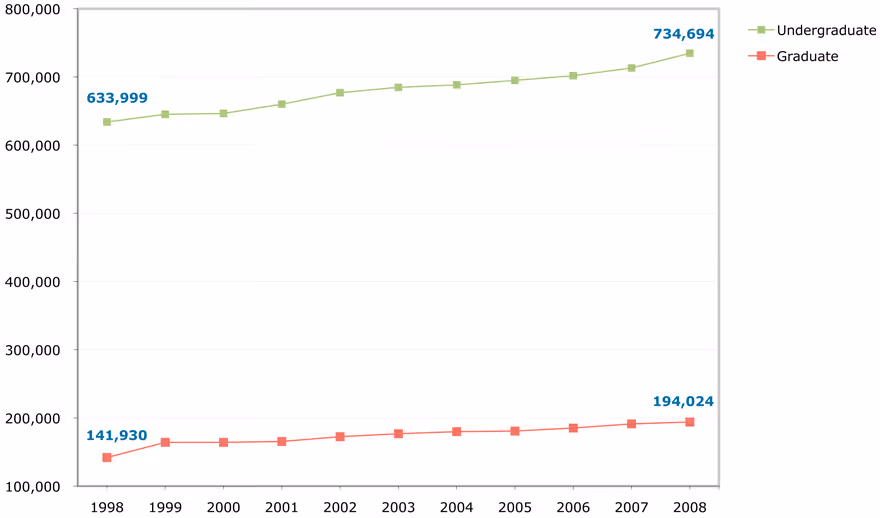
Source: New England Board of Higher Education analysis of U.S. Department of Education data.
Fig. 22: Full-Time vs. Part-Time College Enrollment in New England, 1998 to 2008
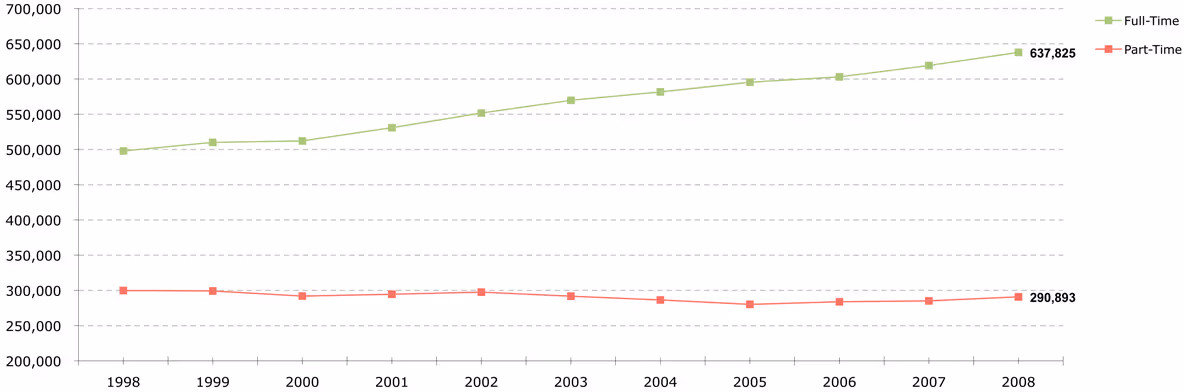
Source: New England Board of Higher Education analysis of U.S. Department of Education data.
Fig. 23: Total Higher Education Enrollment by Gender in New England, 1977 to 2008
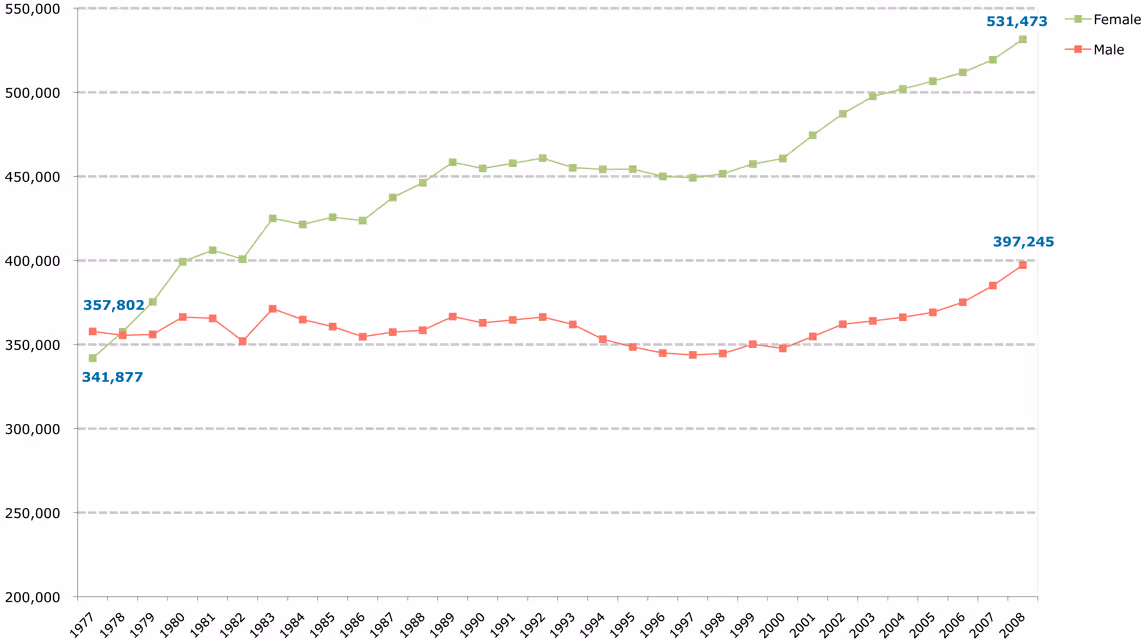
Source: NSF WebCASPAR Database System.
Fig. 24: New England Institutions with the Largest Undergraduate Enrollments, Fall 2008
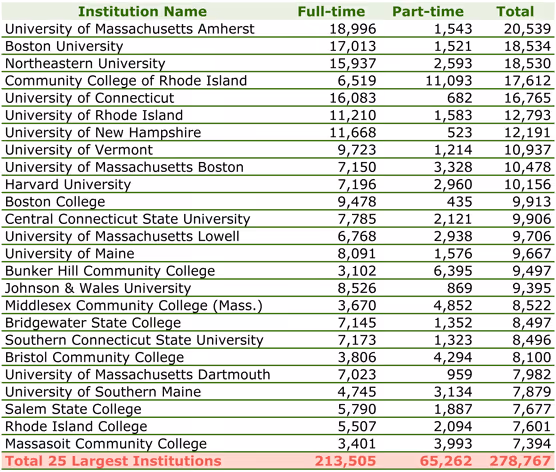
Source: New England Board of Higher Education analysis of U.S. Department of Education data.
Fig. 25: New England Cities with the Largest College Enrollments, 2008
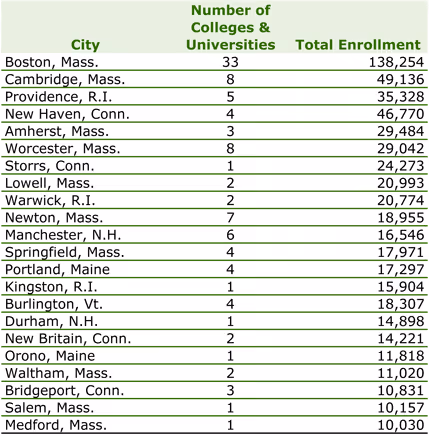
Note: Total enrollment includes full-and part-time undergraduate, graduate and non-degree students.
Source: New England Board of Higher Education analysis of U.S. Department of Education data.
Fig. 26: Enrollment at New England Colleges and Universities by Race/Ethnicity, 2008
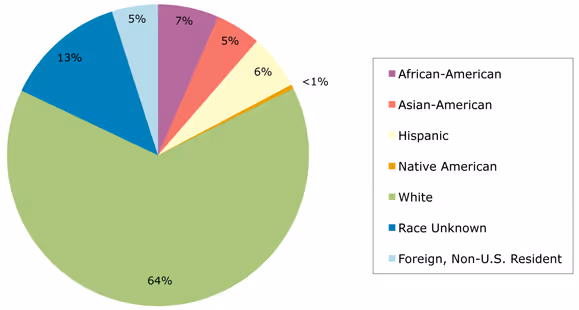
Note: The U.S. Department of Education’s designations of race and ethnicity differ from those of the U.S. Bureau of the Census used in other figures.
Source: New England Board of Higher Education analysis of U.S. Department of Education data.
Fig. 27: Minority Enrollment by State and Race/Ethnicity, 1998 and 2008
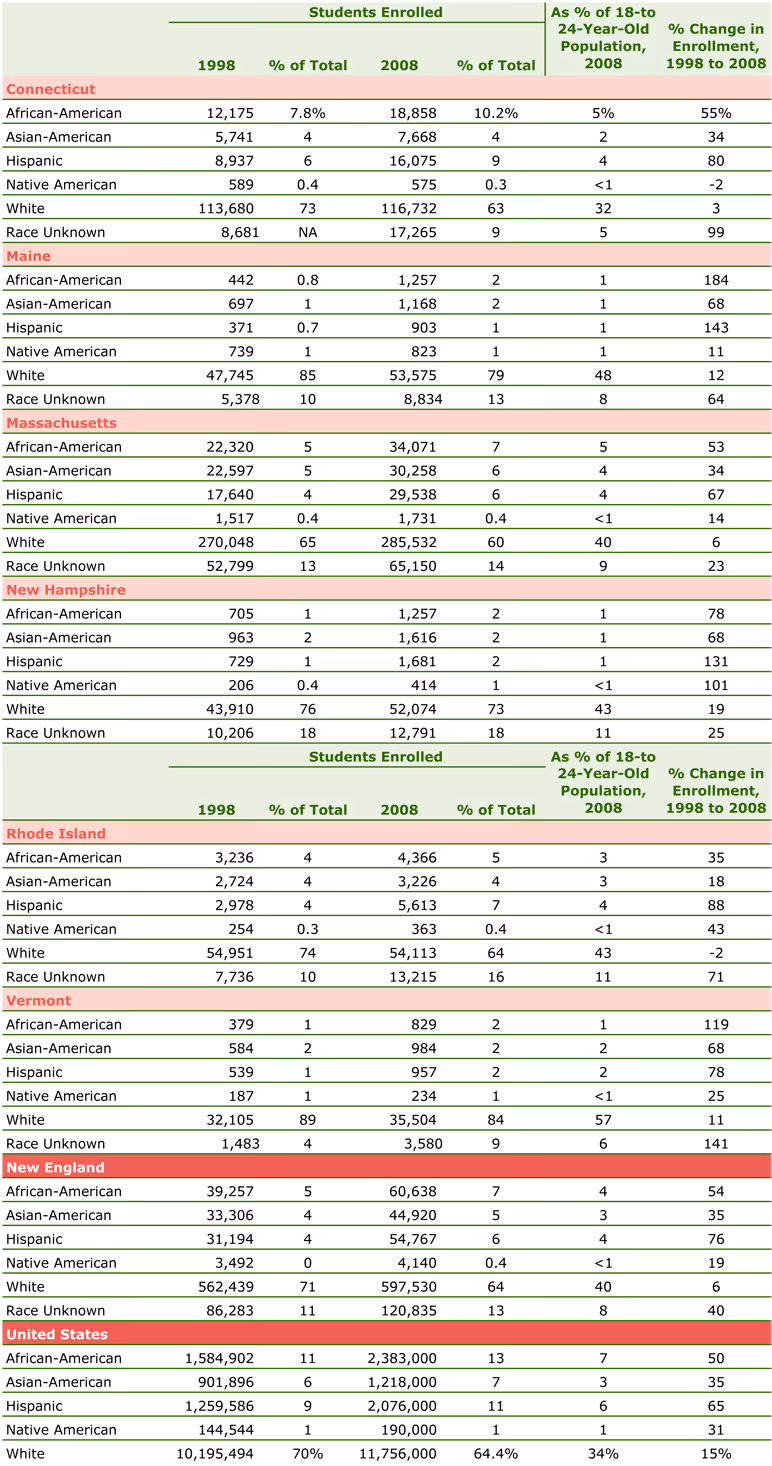
Note: Table does not include enrollment at military academies. African-American, Asian-American, Native American and White totals reflect non-Hispanic population. Does not include the category non-resident alien. United States data are for 2007, the most recent data available.
Source: New England Board of Higher Education analysis of U.S. Department of Education data.
Fig. 28: Public and Private College Enrollment in New England by Race/Ethnicity and Type of Institution, 2008
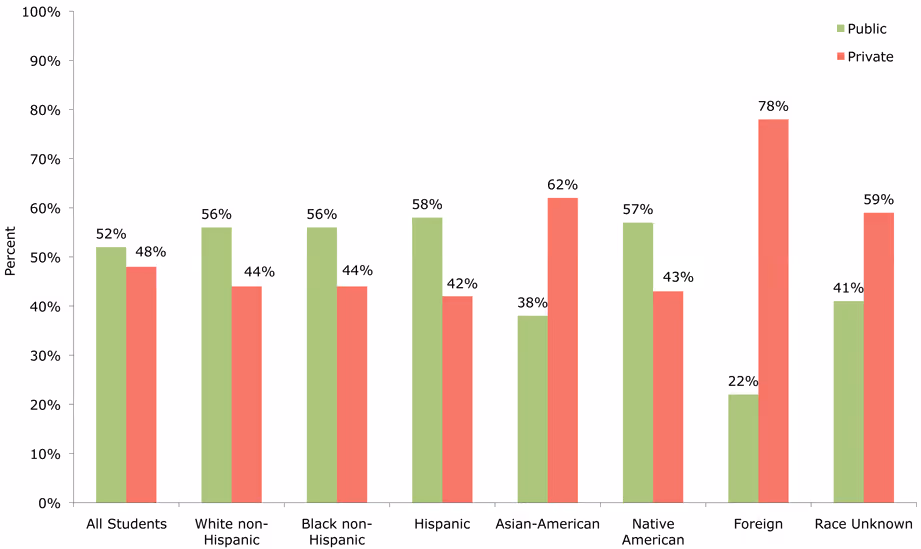
Fig. 29: Foreign Enrollment at New England Colleges and Universities and Share of U.S. Foreign Enrollment, 1980 to 2009
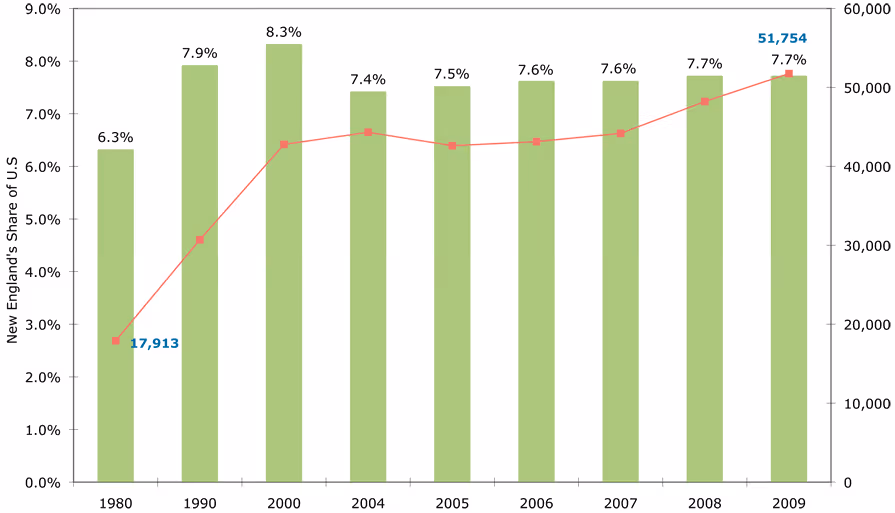
Fig. 30: Foreign Students in New England by Countries of Origin and Fields of Study, 2009
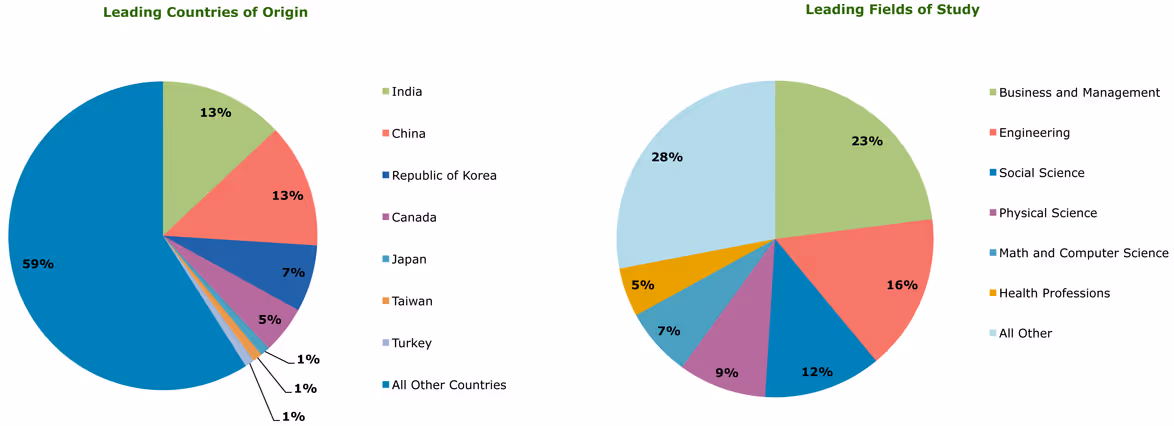
Source: New England Board of Higher Education analysis of Institute of International Education data.
Fig. 31: Estimated Economic Impact from International Students, 2007-08
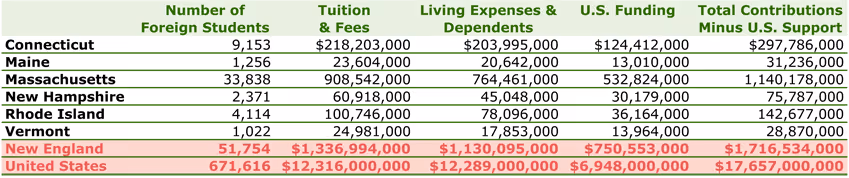
Note: U.S. funding includes support from a U.S. college or university, the U.S. government, a U.S. private sponsor or current employment.
Source: New England Board of Higher Education analysis of NAFSA: Association of International Educators data.
Fig. 32: New England Institutions Enrolling More than 1,000 Foreign Students, 2009
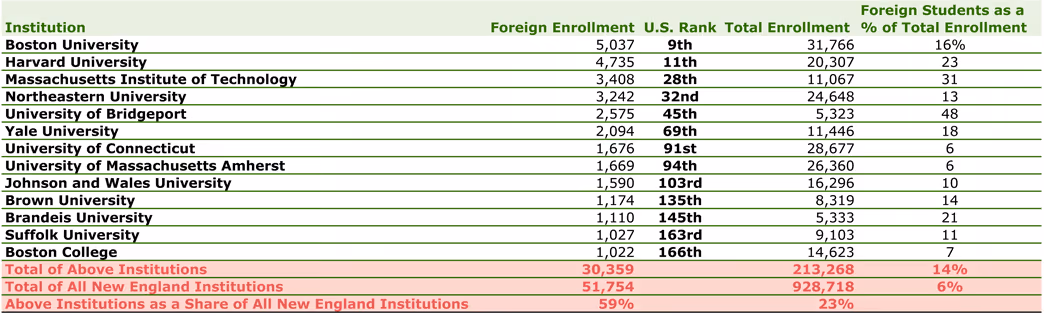
Source: New England Board of Higher Education analysis of Institute of International Education data.
Fig. 33: New England Institutions with More than 10% of Undergraduates Studying Abroad, 2008
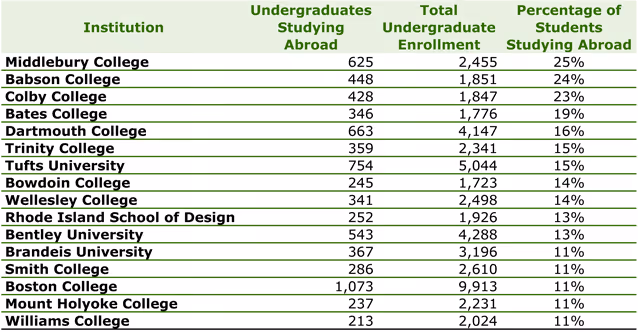
Source: New England Board of Higher Education analysis of Institute of International Education data.